
Bitcoin Bridge Statistics 2026: TeleSwap's Own Volume Data


Our network-stats API shows $576.9M in total volume bridged across 614,123 bridge transactions on 13 supported networks, as of 22 November 2026. Over the last 30 days, users moved $48.7M through the protocol, about $1.6M a day on average, with the busiest day reaching $3.3M on 14 November 2026.
Those are our bitcoin bridge statistics 2026 in two sentences. The rest of this report breaks each number down for readers who are new to crypto. We explain what a "bridge transaction" is, what the averages tell you and what they leave out, and how you can check every figure on the live TeleSwap network stats page.
Key Takeaways:TeleSwap had bridged $576.9M in total volume ($576,858,857 exactly) as of 22 November 2026, according to TeleSwap network stats.TeleSwap had processed 614,123 bridge transactions as of 22 November 2026, according to TeleSwap network stats.Dividing lifetime volume by lifetime transactions gives a mean bridge transaction of roughly $939. This is a mean, not a median, so it says little about the typical transfer.In the 30 days to 22 November 2026, TeleSwap bridged $48.7M, averaging about $1.6M per day, with a peak of $3.3M on 14 November 2026.The last 30 days account for about 8.4% of all volume TeleSwap has ever bridged, which makes the recent window a better signal of current demand than the lifetime total.
Table of Contents
- Finding 1: How Much Bitcoin Bridge Volume Has TeleSwap Processed?
- Finding 2: How Many Bridge Transactions, and How Big Are They?
- Finding 3: Which Networks and Routes Does the Data Cover?
- Finding 4: How Has Bitcoin Bridge Volume in 2026 Changed Recently?
- Methodology: Where These Numbers Come From
- What Is a Bitcoin Bridge, in Plain English?
- Why Does Trustless Bitcoin Bridge Data Matter?
- How Should You Read Bitcoin Bridge Statistics 2026?
- Frequently Asked Questions
- Conclusion
Finding 1: How Much Bitcoin Bridge Volume Has TeleSwap Processed?
As of 22 November 2026, TeleSwap had bridged $576.9M in total volume, or $576,858,857 to the dollar, according to TeleSwap network stats.
New to this? Think of "volume" as the total value of goods that crossed a toll bridge. It counts the trucks and what they carried, not the money parked at the toll booth. Bridge volume measures flow: how much value people have moved over time.
| Metric | Value | As of |
|---|---|---|
| Total volume bridged (rounded) | $576.9M | 22 Nov 2026 |
| Total volume bridged (exact) | $576,858,857 | 22 Nov 2026 |
One thing we deliberately don't report here is total value locked (TVL). TVL is a different measurement, and it isn't part of our data feed. A bridge can show high volume with modest locked value, or the other way round.
Lifetime totals only ever go up, so they always look good. The more useful question is how much of that total came recently, and Finding 4 answers it.
Finding 2: How Many Bridge Transactions, and How Big Are They?
TeleSwap had processed 614,123 bridge transactions as of 22 November 2026, per TeleSwap network stats. Each one is a user moving value between Bitcoin and another network through the protocol.
Once you have total volume and total transaction count, you can work out a simple average:
| Metric | Value | Type |
|---|---|---|
| Total bridge transactions | 614,123 | Reported by API |
| Total volume bridged | $576,858,857 | Reported by API |
| Average volume per transaction | ≈ $939 | Derived ($576,858,857 ÷ 614,123) |
An average is not a median. A few large transfers can pull the mean up, so the "typical" transaction may well be smaller than $939.
The API doesn't publish a size distribution, so we can't tell you the median. We'd rather leave that gap open than guess at it.
Finding 3: Which Networks and Routes Does the Data Cover?
The network-stats API reports 13 supported networks as of 22 November 2026, according to TeleSwap network stats. A "network" here means a blockchain you can bridge Bitcoin to or from.
| Metric | Value | As of |
|---|---|---|
| Supported networks | 13 | 22 Nov 2026 |
| Per-route volume split | Not published by the API | — |
| Per-chain volume split | Not published by the API | — |
We need to be upfront about a limitation. You might expect a report like this to rank routes. The live API reports aggregate totals only. It does not split volume by route or by chain. Any route ranking we published without that data would be a guess presented as a statistic.
We can describe what a route is. A route is a specific trip, such as from native BTC to a particular token on a particular chain. You can see examples on pages like BTC to USDC on Ethereum, BTC to USDT on Polygon, and BTC to ETH on Arbitrum. Each is a one-step bridge-and-swap, where your BTC arrives as the token you wanted on the destination chain. For timing, see how long it takes to bridge Bitcoin.
Finding 4: How Has Bitcoin Bridge Volume in 2026 Changed Recently?
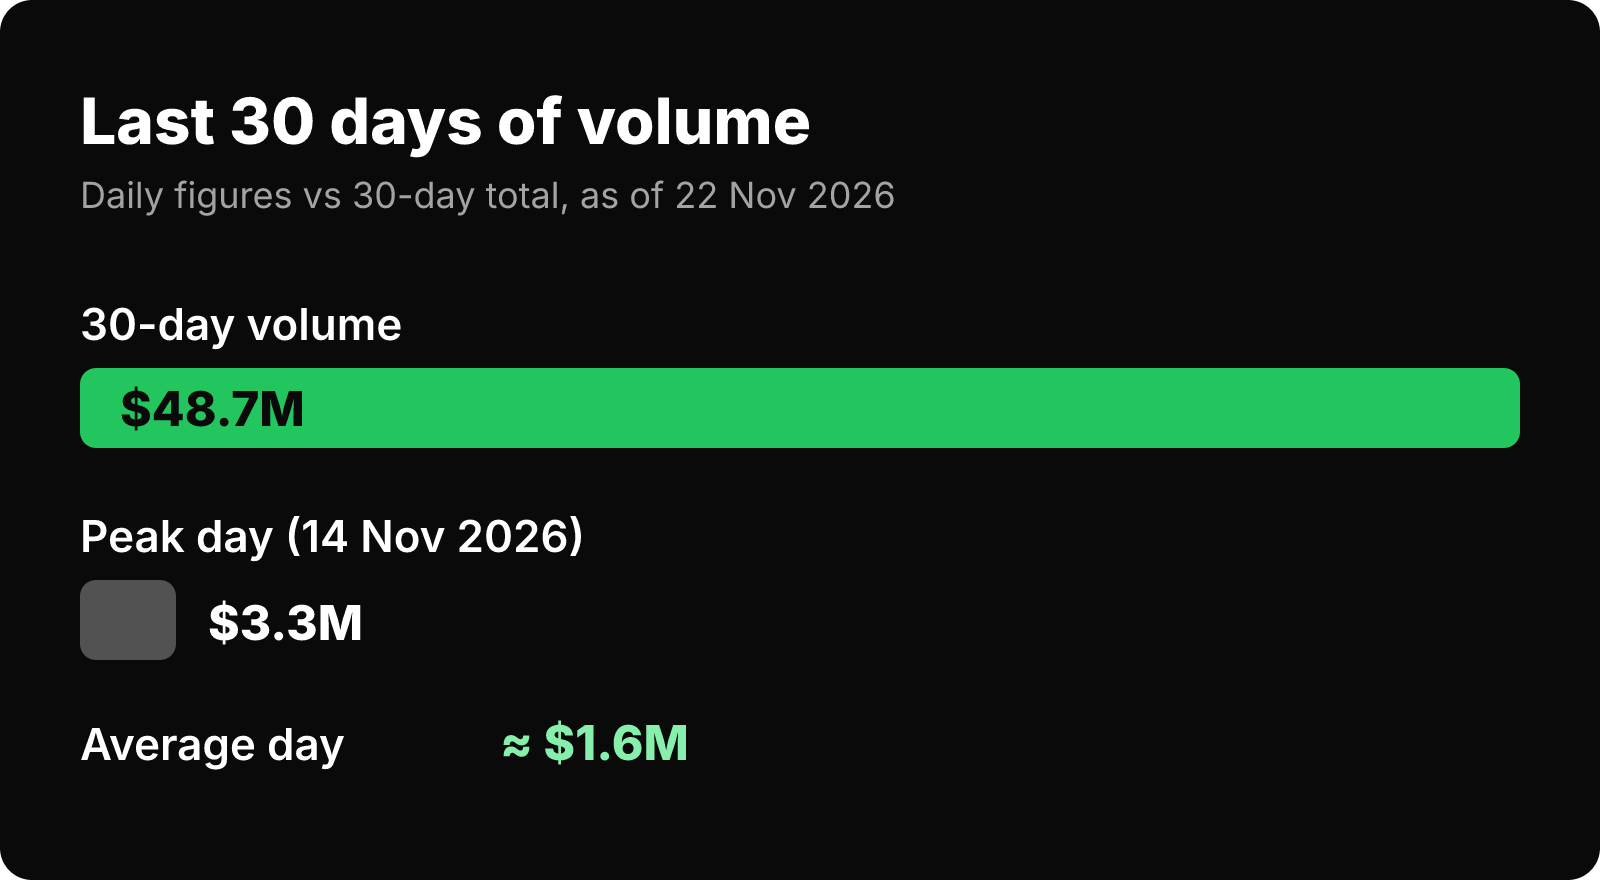
In the 30 days to 22 November 2026, TeleSwap bridged $48.7M, averaging about $1.6M per day, with a single-day peak of $3.3M on 14 November 2026, according to TeleSwap network stats.
| Metric | Value | Type |
|---|---|---|
| 30-day volume | $48.7M | Reported by API |
| Average daily volume (30 days) | ≈ $1.6M | Reported by API |
| Peak day | $3.3M on 14 Nov 2026 | Reported by API |
| 30-day share of lifetime volume | ≈ 8.4% | Derived ($48.7M ÷ $576.9M) |
| Peak day vs. daily average | ≈ 2× | Derived ($3.3M ÷ $1.6M) |
Here is how to read these numbers.
- The recent window matters most. About 8.4% of all volume ever bridged happened in the last 30 days. A protocol whose activity had dried up would show a much smaller share.
- Demand is lumpy. The busiest day was roughly twice the daily average. Bridge activity doesn't arrive at a steady pace.
- One window is not a trend. These figures come from a single 30-day snapshot. They can't tell you on their own whether volume is rising or falling over time.
Methodology: Where These Numbers Come From
Every TeleSwap figure in this report comes from one source: the TeleSwap network-stats API, retrieved on 22 November 2026 and shown publicly at teleswap.xyz/network-stats. We used no figures from memory and no older snapshots.
- Total volume bridged: the API's cumulative USD volume, reported as $576,858,857 and rounded to $576.9M in the text.
- Total bridge transactions: the API's cumulative count, 614,123.
- Supported networks: the API's count of networks, 13.
- 30-day figures: the API's recent-activity window (last 30 days) as retrieved on 22 November 2026. It covers total volume ($48.7M), average daily volume (~$1.6M) and the peak day ($3.3M on 14 November 2026).
- Derived figures: we calculated these ourselves using simple division and labelled each one "Derived" in the tables. They are the average transaction size (≈$939), the 30-day share of lifetime volume (≈8.4%) and the peak-to-average ratio (≈2×).
What's excluded and why:
- TVL is not part of the data feed, so we don't state it.
- Per-route and per-chain splits are not published by the API, so we don't estimate them.
A note on independent trackers. Third-party dashboards such as DefiLlama's Bitcoin bridge page track bridge activity with their own methods. They may cover different chains, routes or time windows, so their figures can differ from first-party APIs. Our figures are self-reported and not independently audited, so compare both sources.
What Is a Bitcoin Bridge, in Plain English?
A Bitcoin bridge is a system that lets you use the value of your BTC on a different blockchain, such as Ethereum or Arbitrum, that can't natively hold bitcoin.
Bitcoin is like a country with a very secure vault but no shops. Ethereum, Polygon, BNB Smart Chain and similar networks are full of shops selling lending, trading and stablecoins, but they don't accept bitcoin at the door. A bridge works like a currency exchange at the border: you hand over BTC on one side and receive a token on the other that represents your BTC.
The key question is who guards the BTC while its representation is out in the world. There are broadly three answers:
- A company holds it (custodial). You trust that firm to keep the coins and give them back.
- A group of signers holds it (federated or threshold). You trust that enough members of the group stay honest.
- Code checks Bitcoin directly (light-client based). A smart contract verifies Bitcoin's own proof-of-work record before anything is created on the other chain.
That third approach builds on simplified payment verification (SPV), an idea described in the original Bitcoin whitepaper. A "light client" doesn't download all of Bitcoin's history. It checks the chain of block headers and a compact proof that your transaction is in a block.
Why Does Trustless Bitcoin Bridge Data Matter?
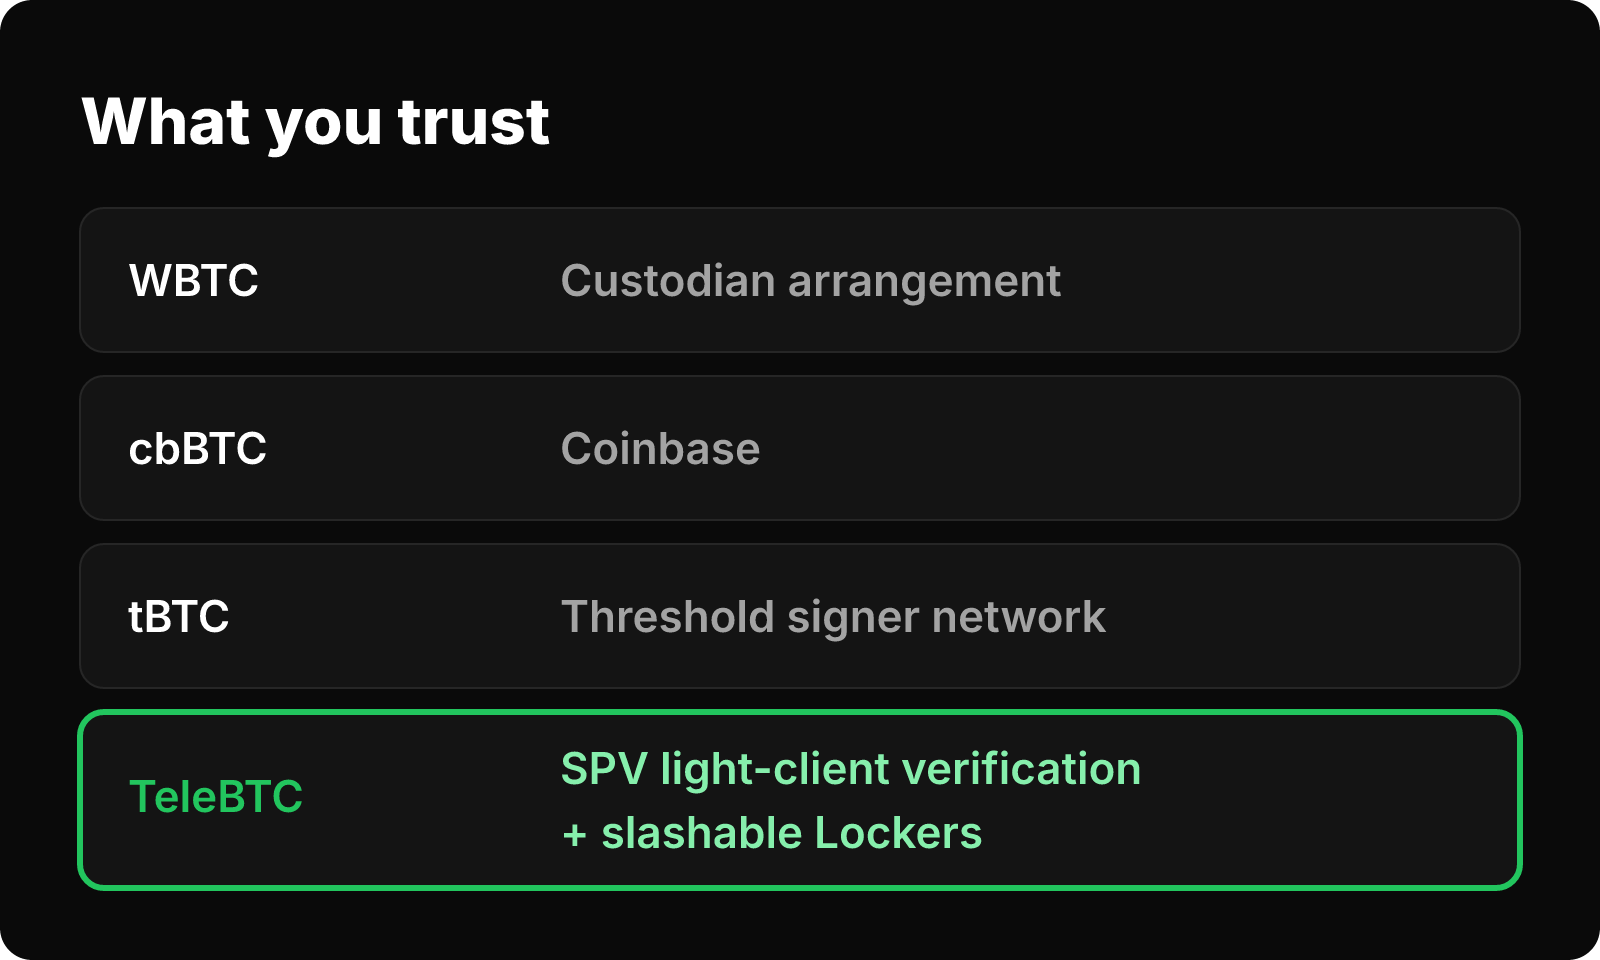
Volume tells you a bridge is used. It doesn't tell you a bridge is safe. To judge a bridge you need both usage numbers and an understanding of its trust model. Here's how the main wrapped-Bitcoin designs compare on the second point; our wrapped Bitcoin tokens list goes deeper.
| Token | Who secures the BTC | What you trust | Source |
|---|---|---|---|
| WBTC | Custodian arrangement | The custodian(s) holding the reserve BTC | WBTC |
| cbBTC | Coinbase | A single regulated company's custody | Coinbase |
| tBTC | Threshold signer network | An honest threshold of a rotating signer group | Threshold docs |
| TeleBTC | SPV light-client verification plus collateral-backed, slashable Lockers | Bitcoin's proof-of-work; nothing is minted without a verified BTC transaction | TeleSwap docs |
TeleBTC is backed one-for-one by real BTC and secured by SPV light-client proofs rather than a custodian or a multi-sig committee. Custody is collateral-backed and slashable, so misbehaviour costs the operator real money.
All of these designs carry some risk, and smart contracts can have bugs. What changes is where the trust sits. For a fuller risk checklist, read Bitcoin bridge security in 2026.
How Should You Read Bitcoin Bridge Statistics 2026?
Read bridge statistics by asking three questions: is the source first-party or independent, what time window does it cover, and what exactly is being counted? Here's a practical checklist you can use on any bridge, including ours:
- Find the source. Is the number from the protocol's own API, or from a tracker like DefiLlama? Look at both.
- Check the date. A lifetime total with no "as of" date tells you very little. Every figure in this report is dated 22 November 2026.
- Prefer recent windows over lifetime totals. A 30-day number shows current use. A lifetime number mostly shows age.
- Separate volume from locked value. Flow and stock are different things.
- Ask what isn't shown. We told you our API has no route split. A good data source is honest about its blind spots.
- Pair data with design. Usage numbers should come alongside a clear explanation of who controls the BTC.
The most-quoted bridge number, the lifetime total, is usually the least informative. To see whether a bridge is alive today, look at the 30-day share and the gap between the peak day and the average day.
Frequently Asked Questions
What are TeleSwap's bitcoin bridge statistics for 2026?
As of 22 November 2026, TeleSwap had bridged $576.9M in total volume across 614,123 bridge transactions on 13 supported networks. In the 30 days to that date, it bridged $48.7M, averaging about $1.6M per day. All figures come from the live TeleSwap network stats API.
What was TeleSwap's bitcoin bridge volume in the last 30 days?
TeleSwap's 30-day bitcoin bridge volume was $48.7M as of 22 November 2026. That works out to about $1.6M per day, with a peak of $3.3M on 14 November 2026. It is roughly 8.4% of all volume the protocol has ever bridged.
Does TeleSwap publish volume by route or by chain?
No, the network-stats API currently reports aggregate totals only, not per-route or per-chain splits. That is why this report doesn't rank routes. Individual routes, such as BTC to USDC on Ethereum, have their own swap pages, but route-level volume isn't part of the public data feed.
What is the average size of a TeleSwap bridge transaction?
The mean is roughly $939 per transaction, calculated by dividing $576,858,857 in lifetime volume by 614,123 transactions. This is a mean, not a median, so a few large transfers may push it up. The API does not publish a size distribution.
Why do third-party trackers show different bridge numbers?
Third-party trackers often use different scopes, so their figures can differ from a protocol's own API. They may track different chains or routes, or use different time windows. Comparing a first-party API with an independent dashboard like DefiLlama is the best way to understand a bridge's activity.
What makes a Bitcoin bridge trustless?
A bridge is trust-minimized when code verifies Bitcoin transactions directly, instead of relying on a company or a signer committee to confirm them. TeleBTC uses SPV light-client proofs to verify each Bitcoin transaction before minting, and its collateral-backed Lockers can be slashed for misbehaviour.
Does TeleSwap report TVL?
No, TVL is not part of the network-stats data feed, so we don't state it. The API reports volume, transaction count, supported networks and recent daily activity. These measure flow (value moved), not stock (value locked).
Conclusion
Our bitcoin bridge statistics for 2026 come down to three points:
- Scale: $576.9M bridged across 614,123 transactions on 13 networks, as of 22 November 2026.
- Current use: $48.7M in the last 30 days, about 8.4% of lifetime volume, with demand peaking at $3.3M on 14 November 2026.
- Honest limits: no route split, no TVL and no trend from a single snapshot. We'd rather show the gaps than fill them with guesses.
Usage only means something next to a sound trust model. If you want to move BTC onto another chain without depending on a custodian, you can see how SPV-verified bridging works in the TeleSwap docs, check the live numbers at teleswap.xyz/network-stats, and try a route at teleswap.xyz.